Want to figure out what that SAFE is going to do to your cap table when it converts?
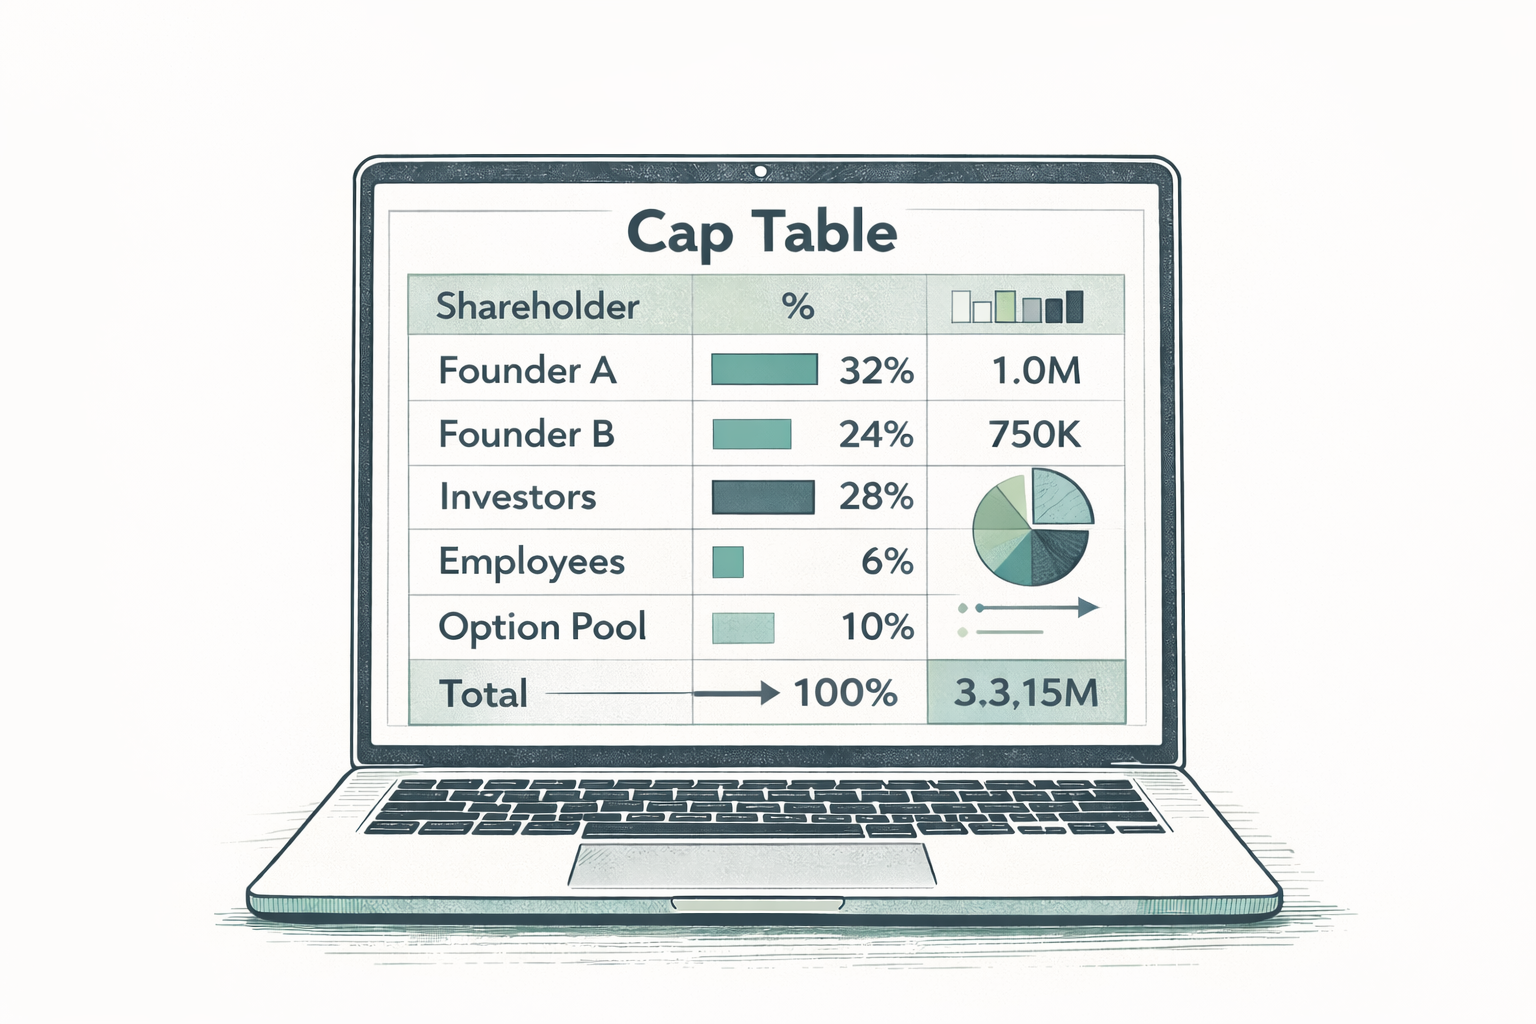
I’ve been working with a lot of founders that are looking at financing options, and decided to make a lightweight tool to enable some high level scenario analysis. Upround? Downround? Dilution percentage? High level, it’s all here. Want to talk strategy? grab a slot to chat https://calendar.app.google/BvkXTSb3twVnybKQ9